Article · Environment · 6 min read
What Alberta's wildfire cause records actually show
You asked us for an arson versus lightning breakdown of the wildfires we mapped. Only Alberta publishes one. It shows arson is a rounding error by area, 95 per cent of it a single fire, and a fifth of what Alberta maps has no cause in the province's own file — though other governments hold one for almost all of it.
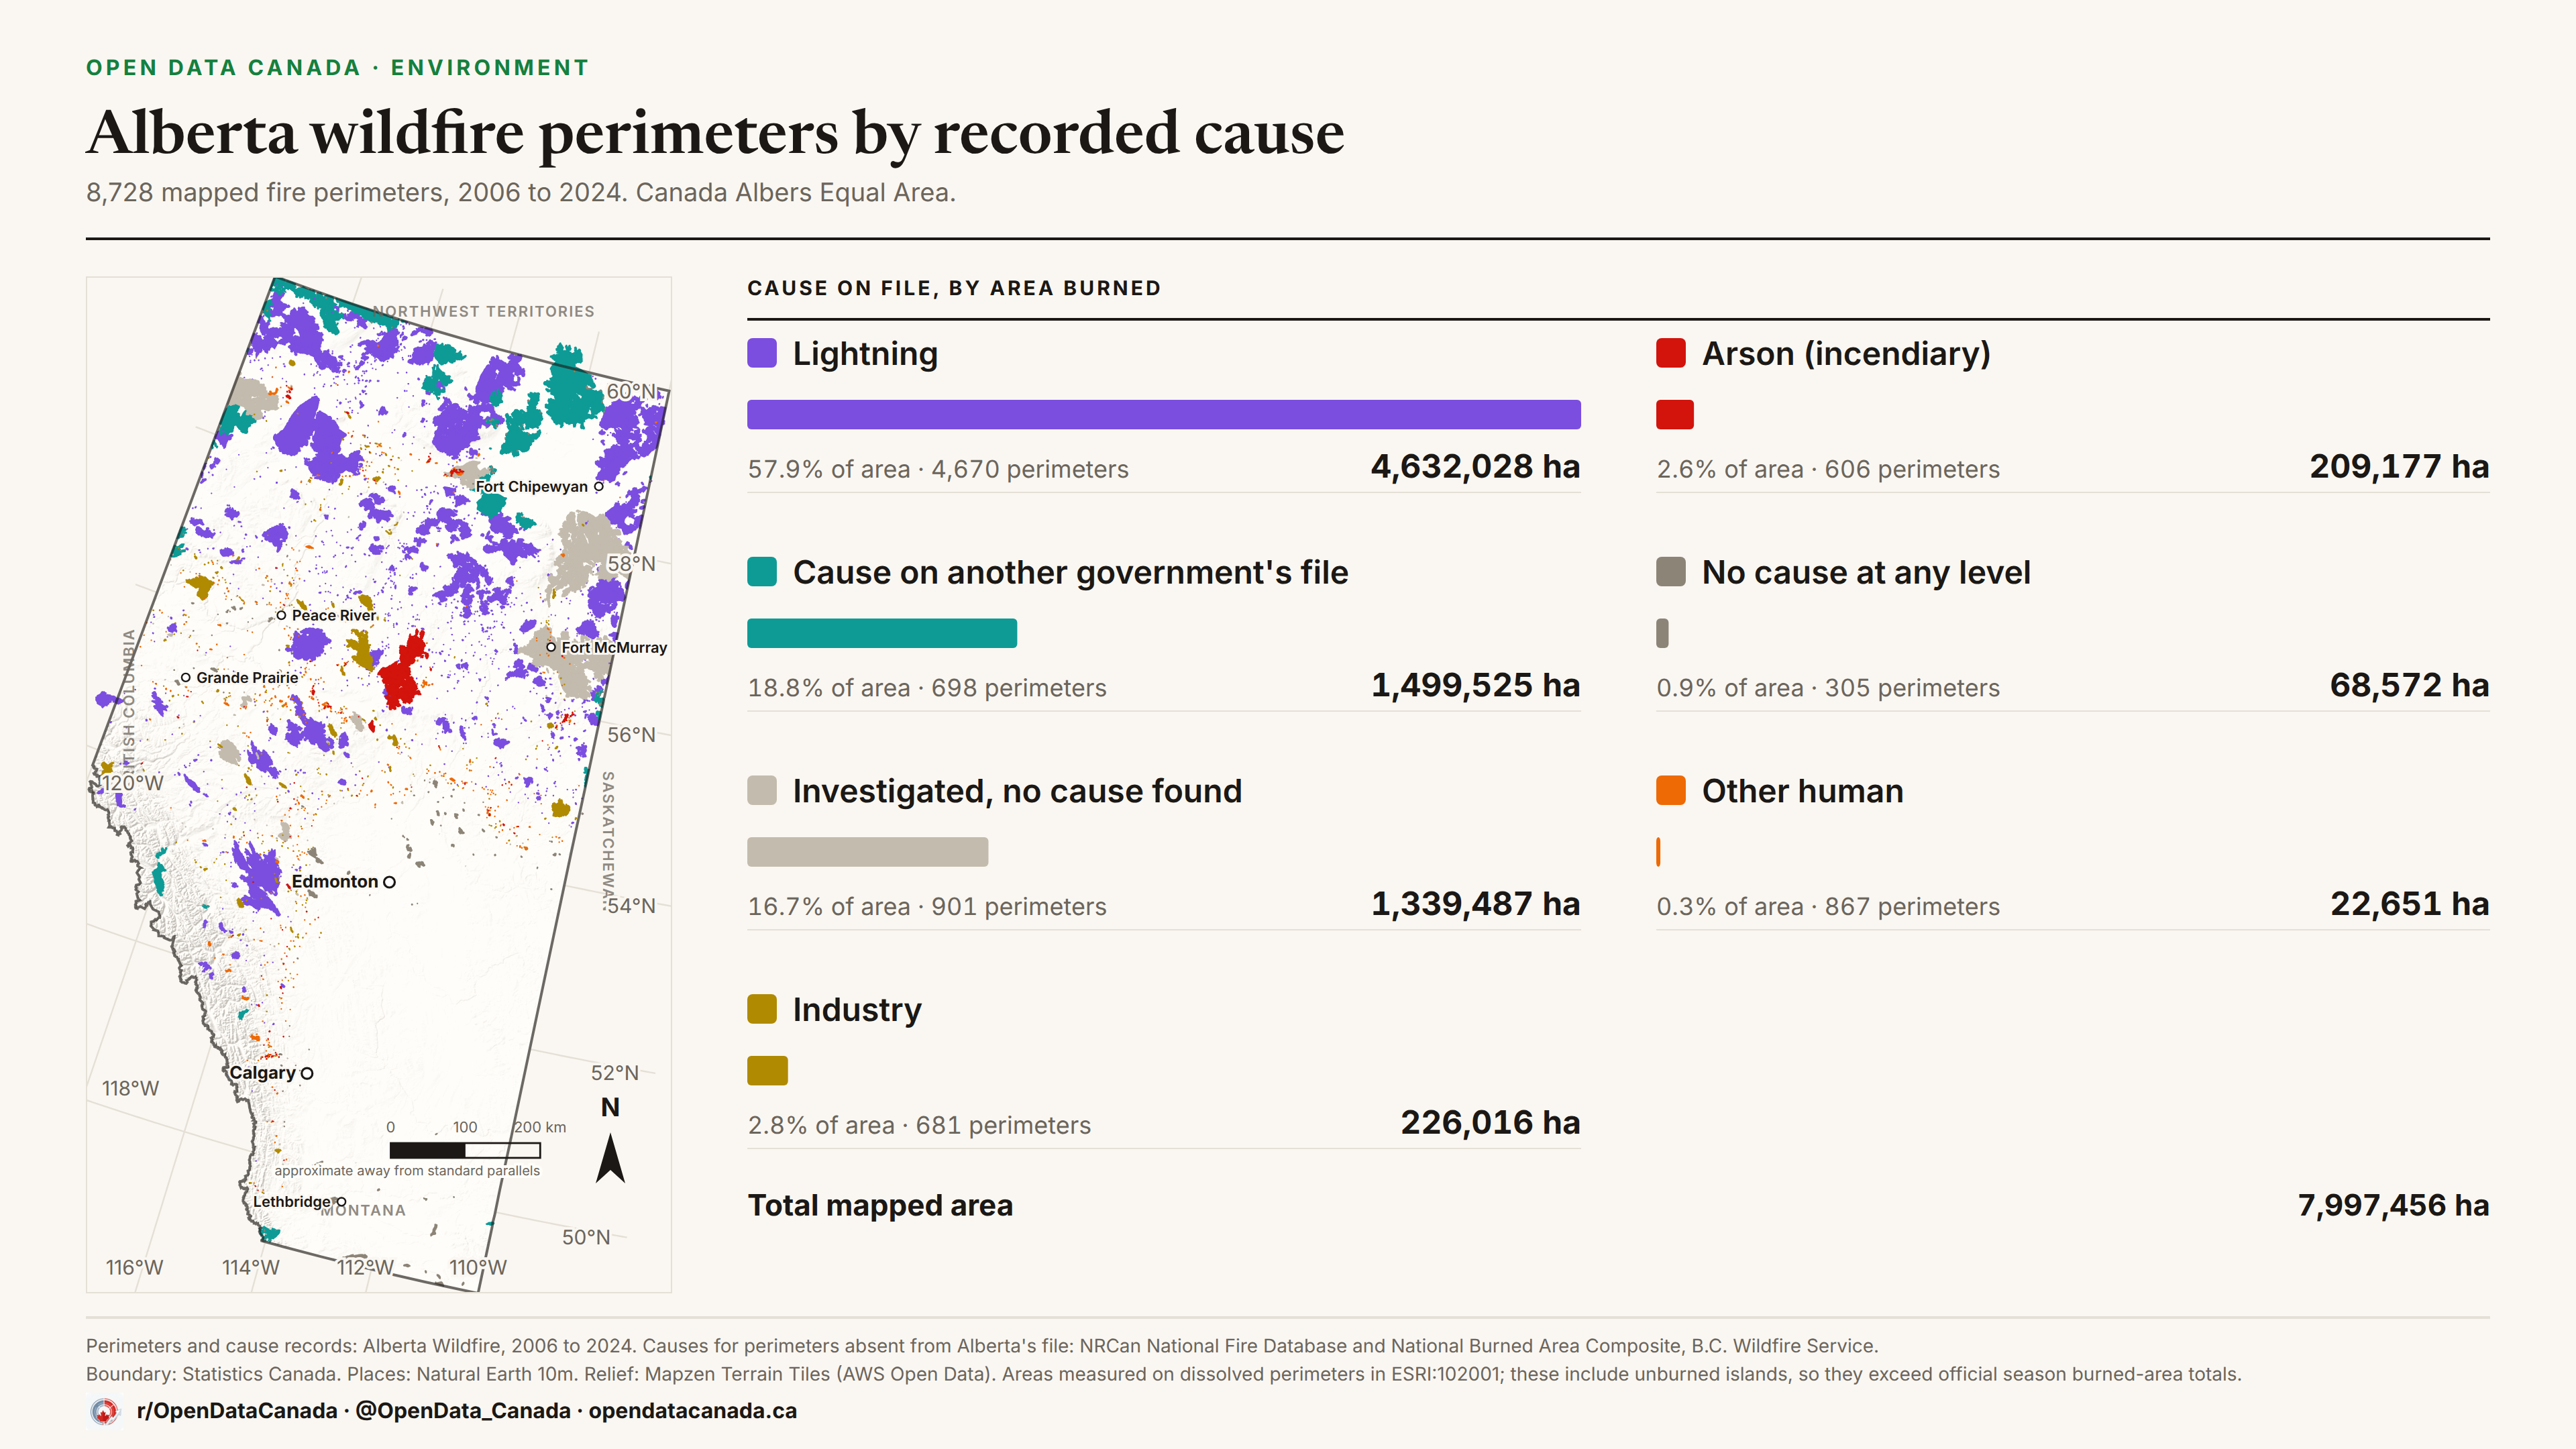
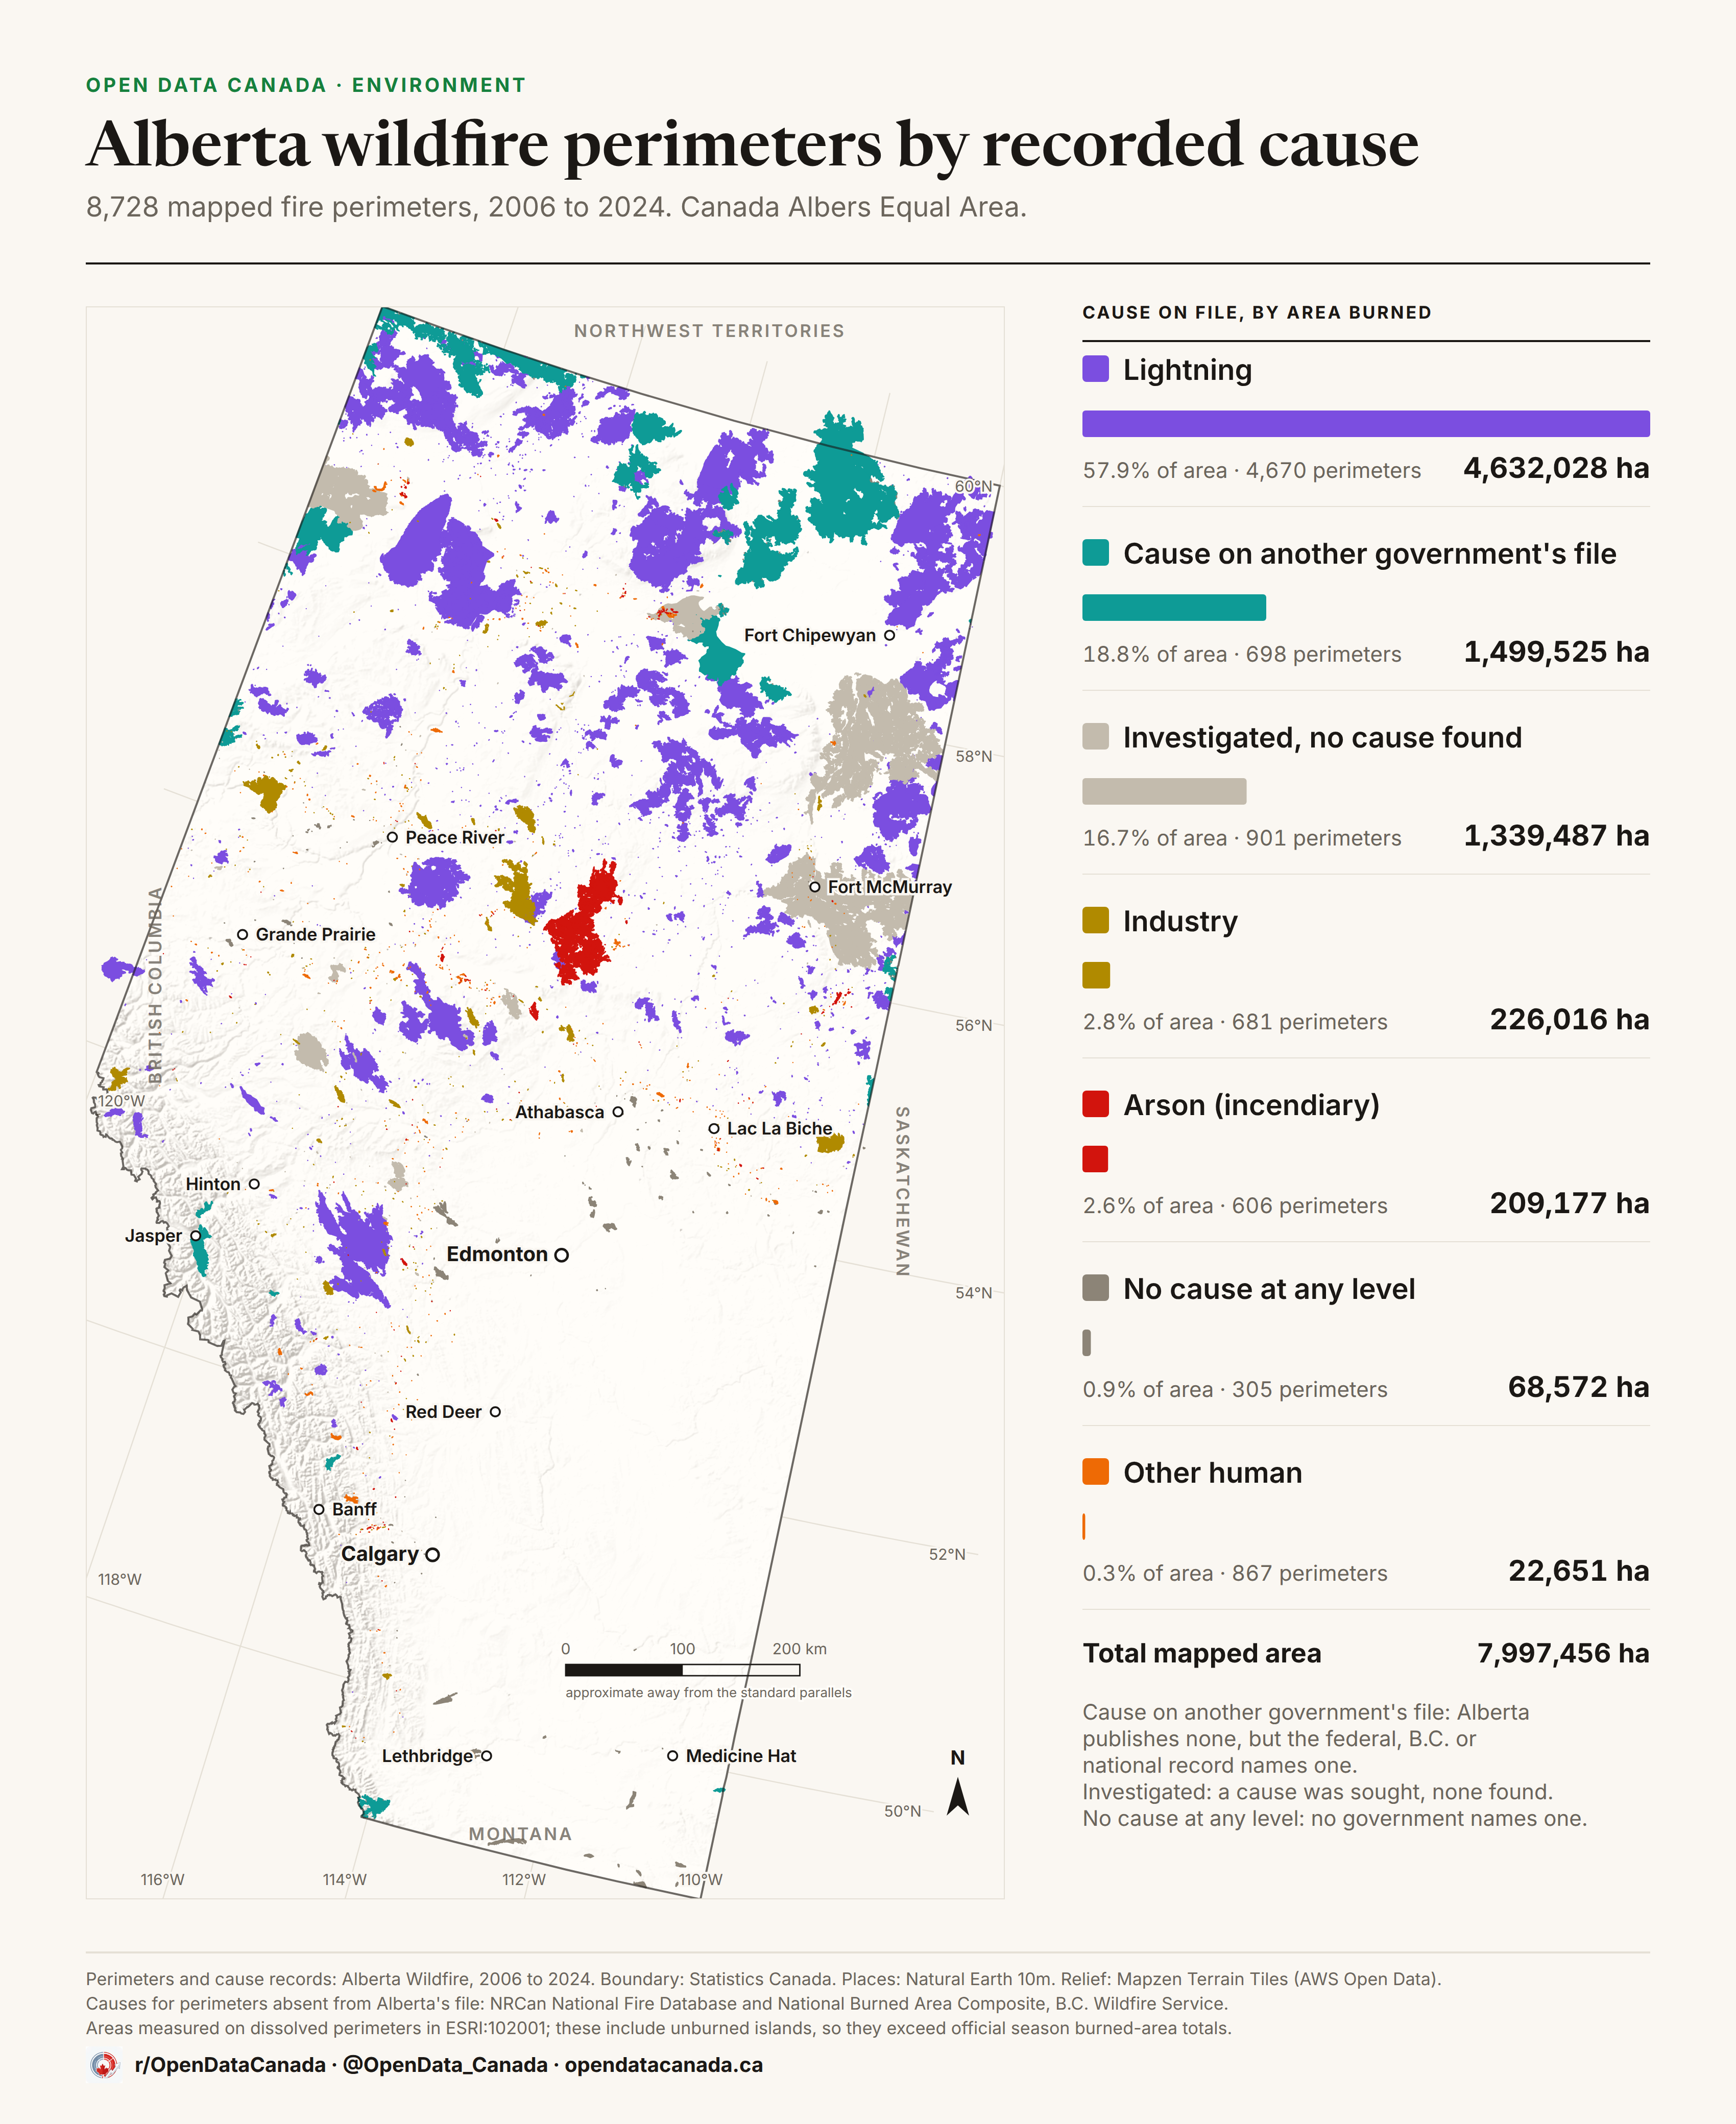
When we mapped every wildfire perimeter in British Columbia and Alberta, the question that kept coming back was the one the map could not answer. How much of it was arson?
Only Alberta publishes a category for deliberately set fires. British Columbia separates a lightning strike from an arsonist with one word, "person", and stops. So we pulled Alberta's cause records, 26,551 fires over nineteen years, and joined them to the perimeters.
Arson is one fire
Alberta codes deliberately set fires as "incendiary", a category broader than arson that sweeps in every case nobody was charged for. There were 2,324 between 2006 and 2024, and the 285 big enough to leave a mapped perimeter burned 209,177 hectares, 2.6 per cent of everything the province mapped.
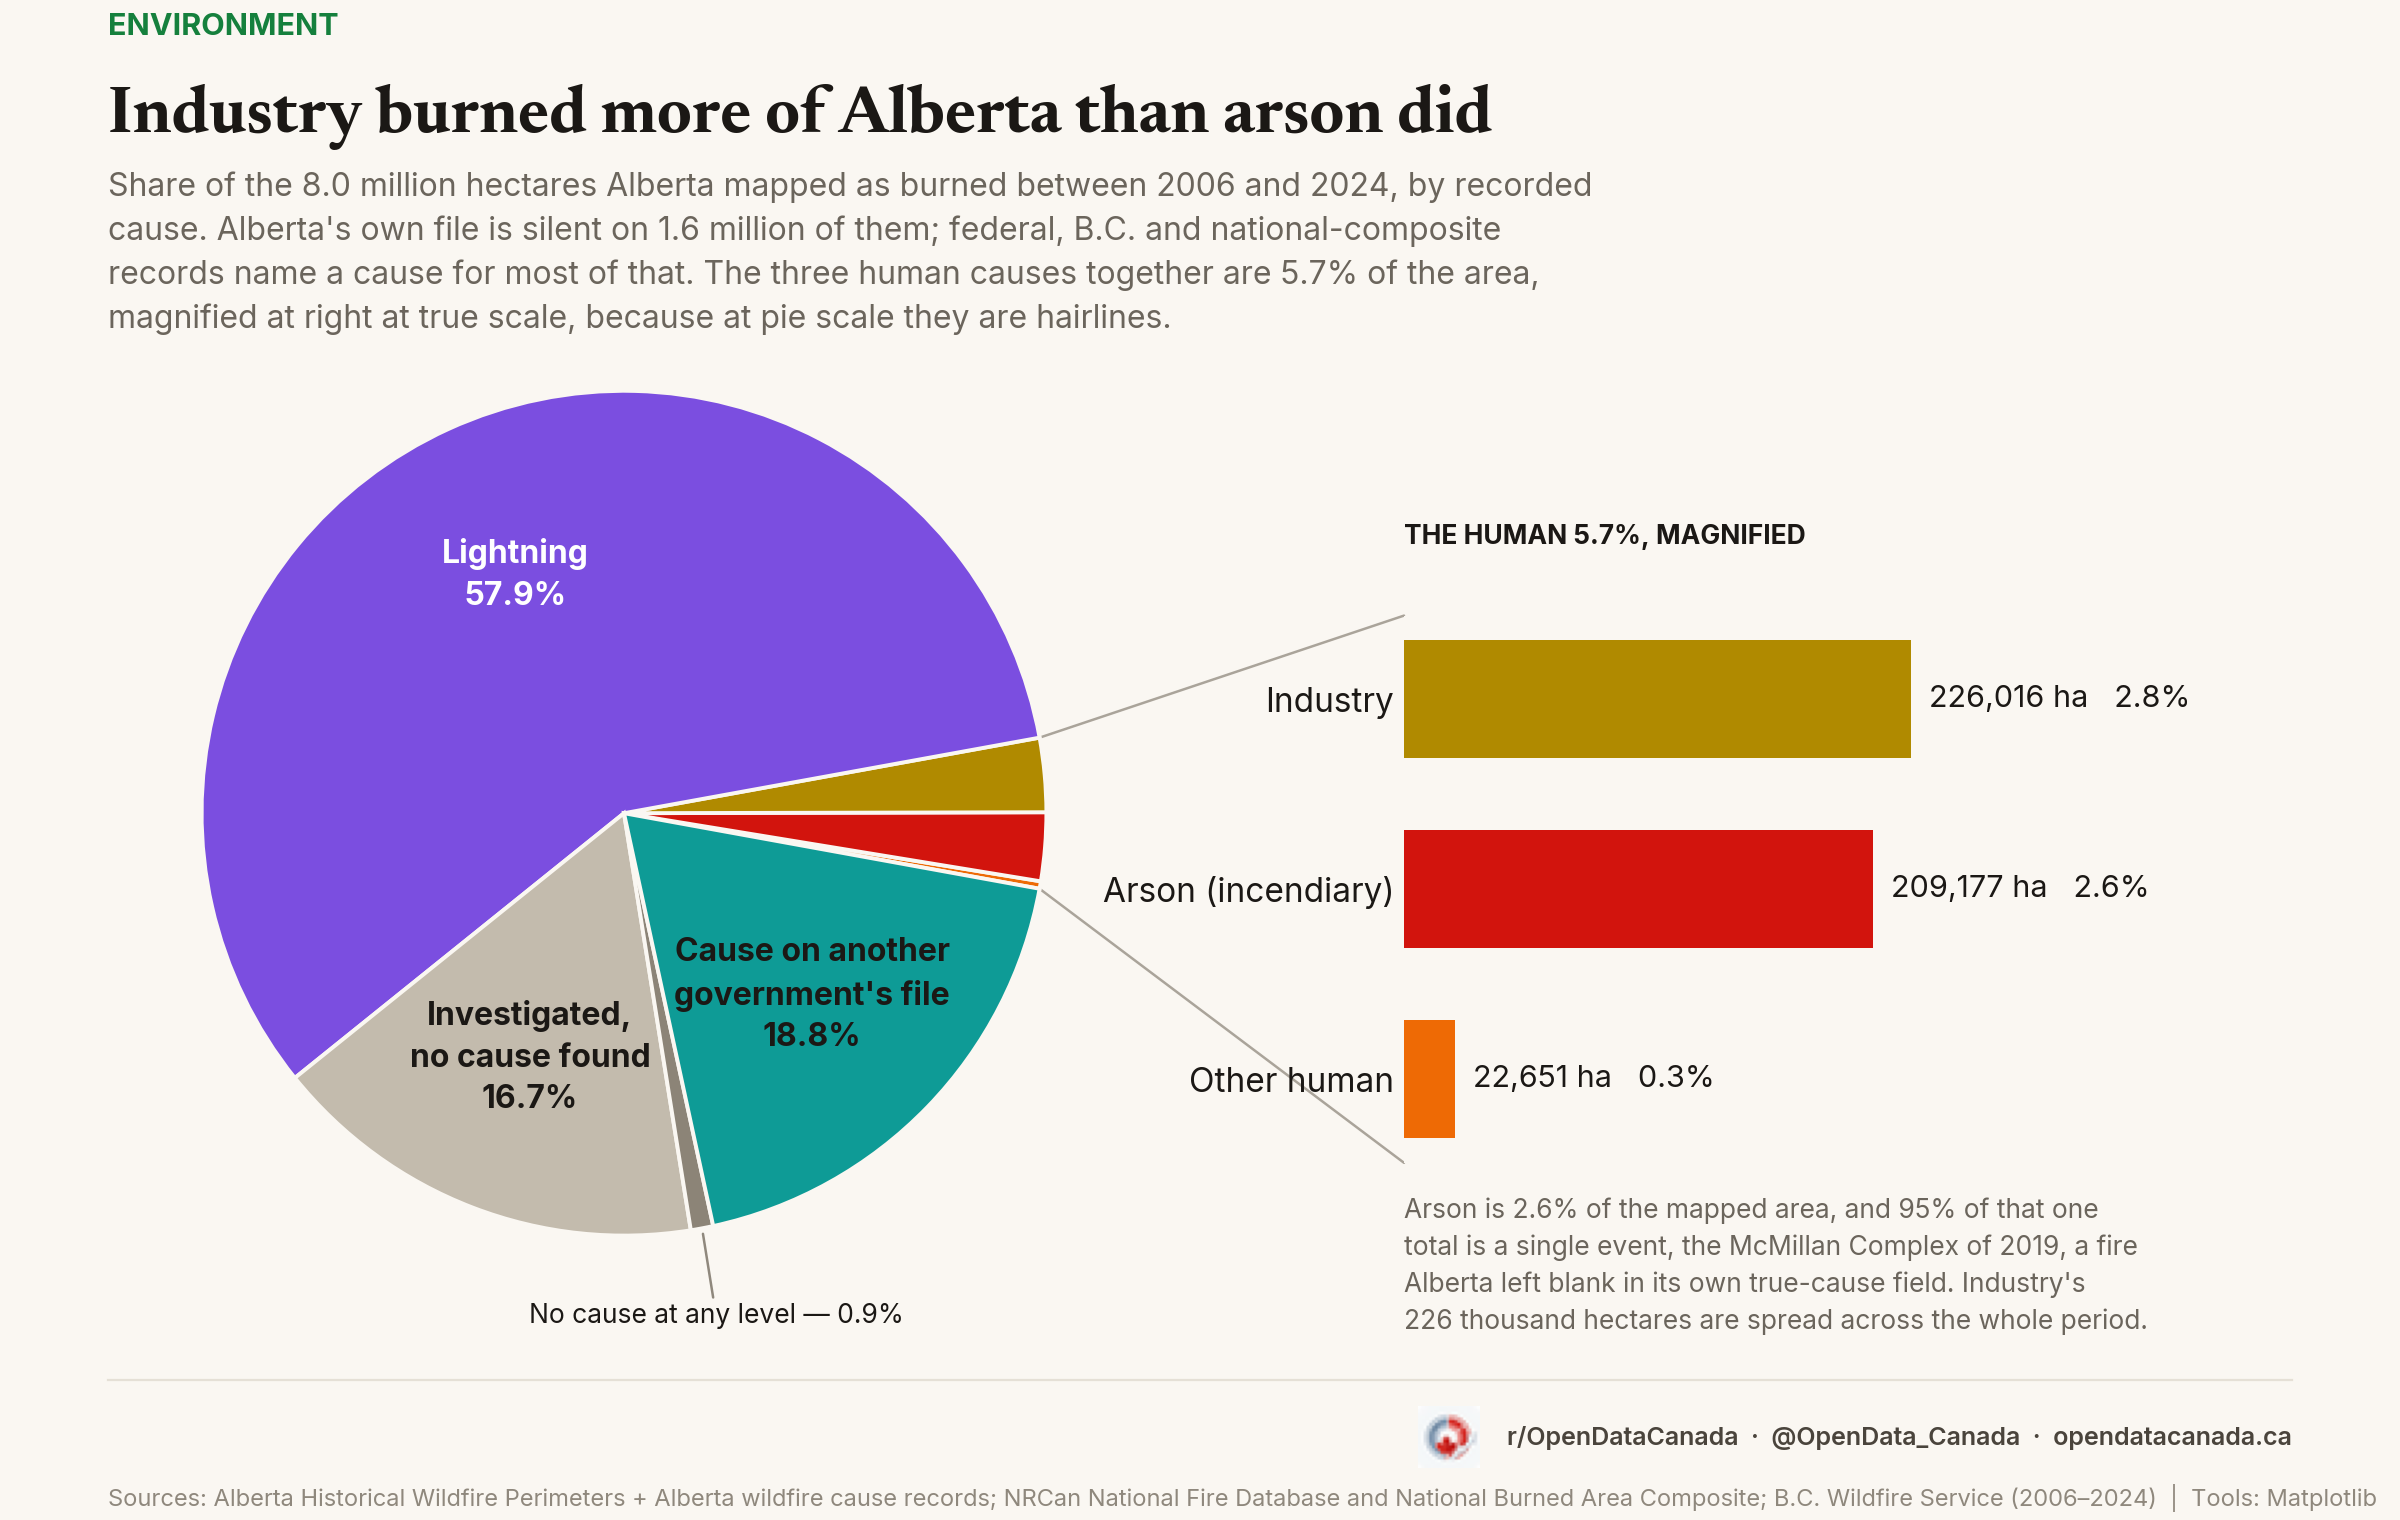
Almost all of it is one event. The McMillan Complex, northwest of Slave Lake in 2019, accounts for 199,073 hectares, 95 per cent of every arson hectare in the province. Every other arson fire in nineteen years comes to about 10,100 hectares. The label is soft even there: Alberta logged McMillan's activity as arson but left the true-cause field blank, so it was never confirmed.
Powerlines burn more than every arson fire but one
Alberta splits human causes into twelve categories. Ranked by hectares they look nothing like the argument online.
| Cause | Hectares burned, 2006 to 2024 |
|---|---|
| Lightning | 4,632,028 |
| Not in Alberta's file — cause held by another government | 1,499,525 |
| Investigated, no cause found | 1,339,487 |
| Industry | 226,016 |
| Arson (incendiary) | 209,177 |
| No cause at any level of government | 68,572 |
| Other human | 22,651 |
The second and sixth rows were a single line of 1,568,097 hectares when this piece went up, labelled "no cause on file". They are the same perimeters; the split is explained below.
Industry burned 226,016 hectares, more than every arson fire combined, and not because six categories were bundled. Powerlines alone burned 138,051 hectares, thirteen times the arson record once McMillan is set aside, and unlike McMillan they are spread across the whole period and the whole province. Oil and gas adds 43,793. Forestry, blamed most often by readers last time, ignited 32 mapped fires for 17,849 hectares. Whether logging or decades of fire suppression change how a fire behaves once it starts is a question this data can't answer.
People keep asking about the government. Fires Alberta attributes to itself burned 772 hectares across 19 mapped fires, escaped prescribed burns another 1,793 across four: 0.03 per cent of the mapped area, from Alberta's own file.
Count fires instead of hectares and it flips
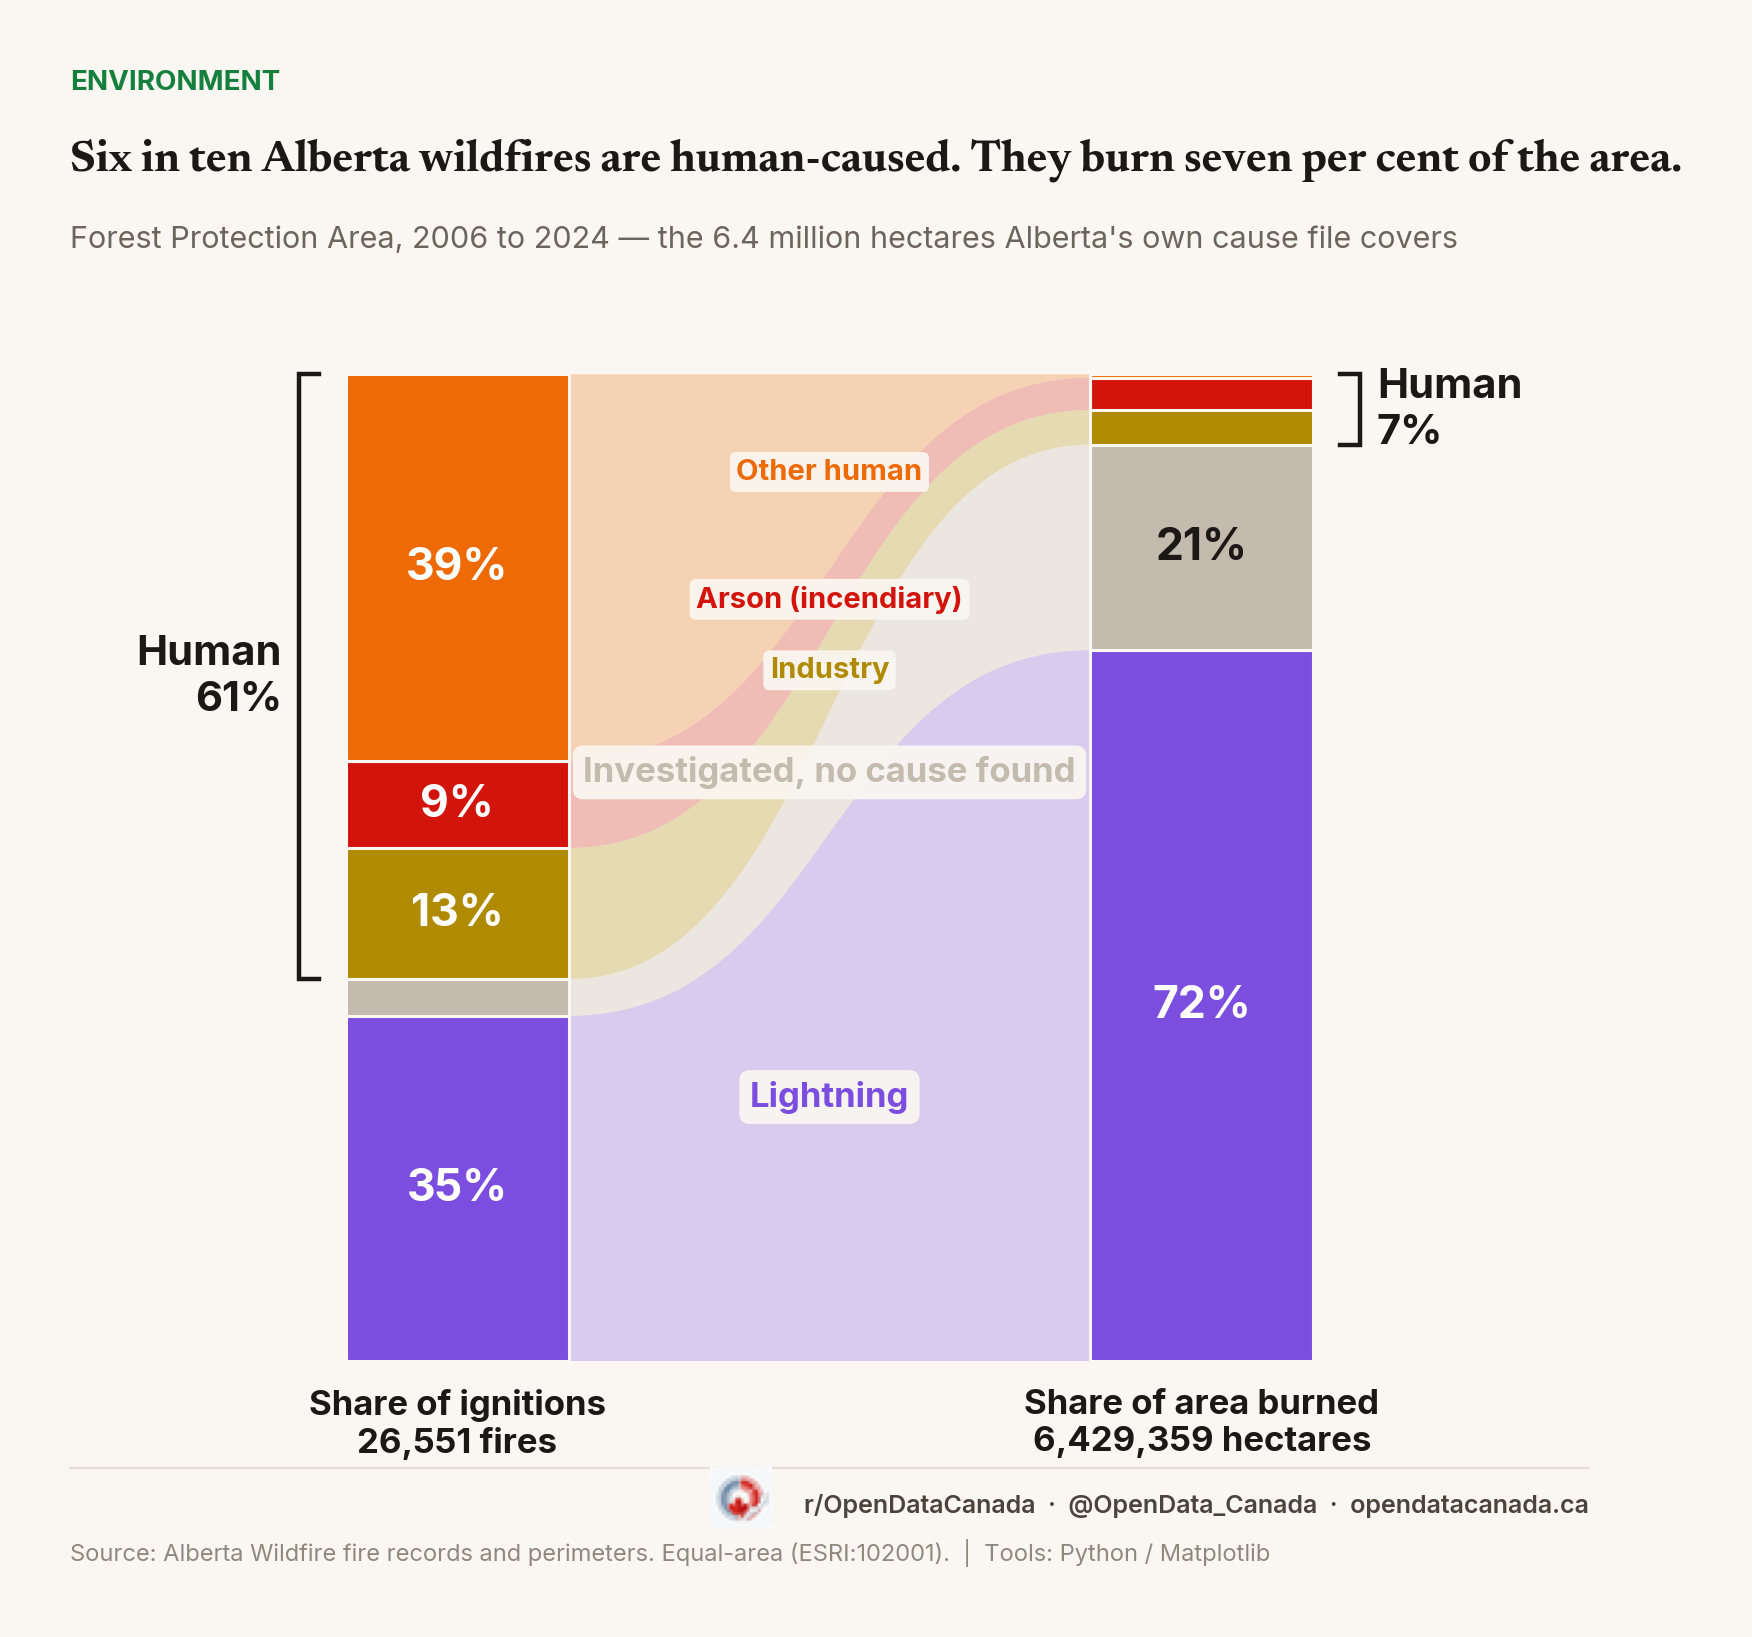
The counter-argument holds up. Inside the zone Alberta patrols, people start 61 per cent of the fires and lightning 35. Every headline saying most wildfires are human-caused comes from there.
Those fires also burn 7 per cent of the area inside that zone. Human fires start beside roads, where crews reach them first: half of them are within 140 metres of one, against 5.5 kilometres for the median lightning strike. The average incendiary fire burned 101 hectares, the average lightning fire 495. We lead with area because area is what the season totals and the smoke measure.
What the 61 per cent actually is
Alberta records two levels below the cause class: what the person was doing, and how the fire got away. Put together they name the largest identified ignition source in Alberta's record after lightning itself.
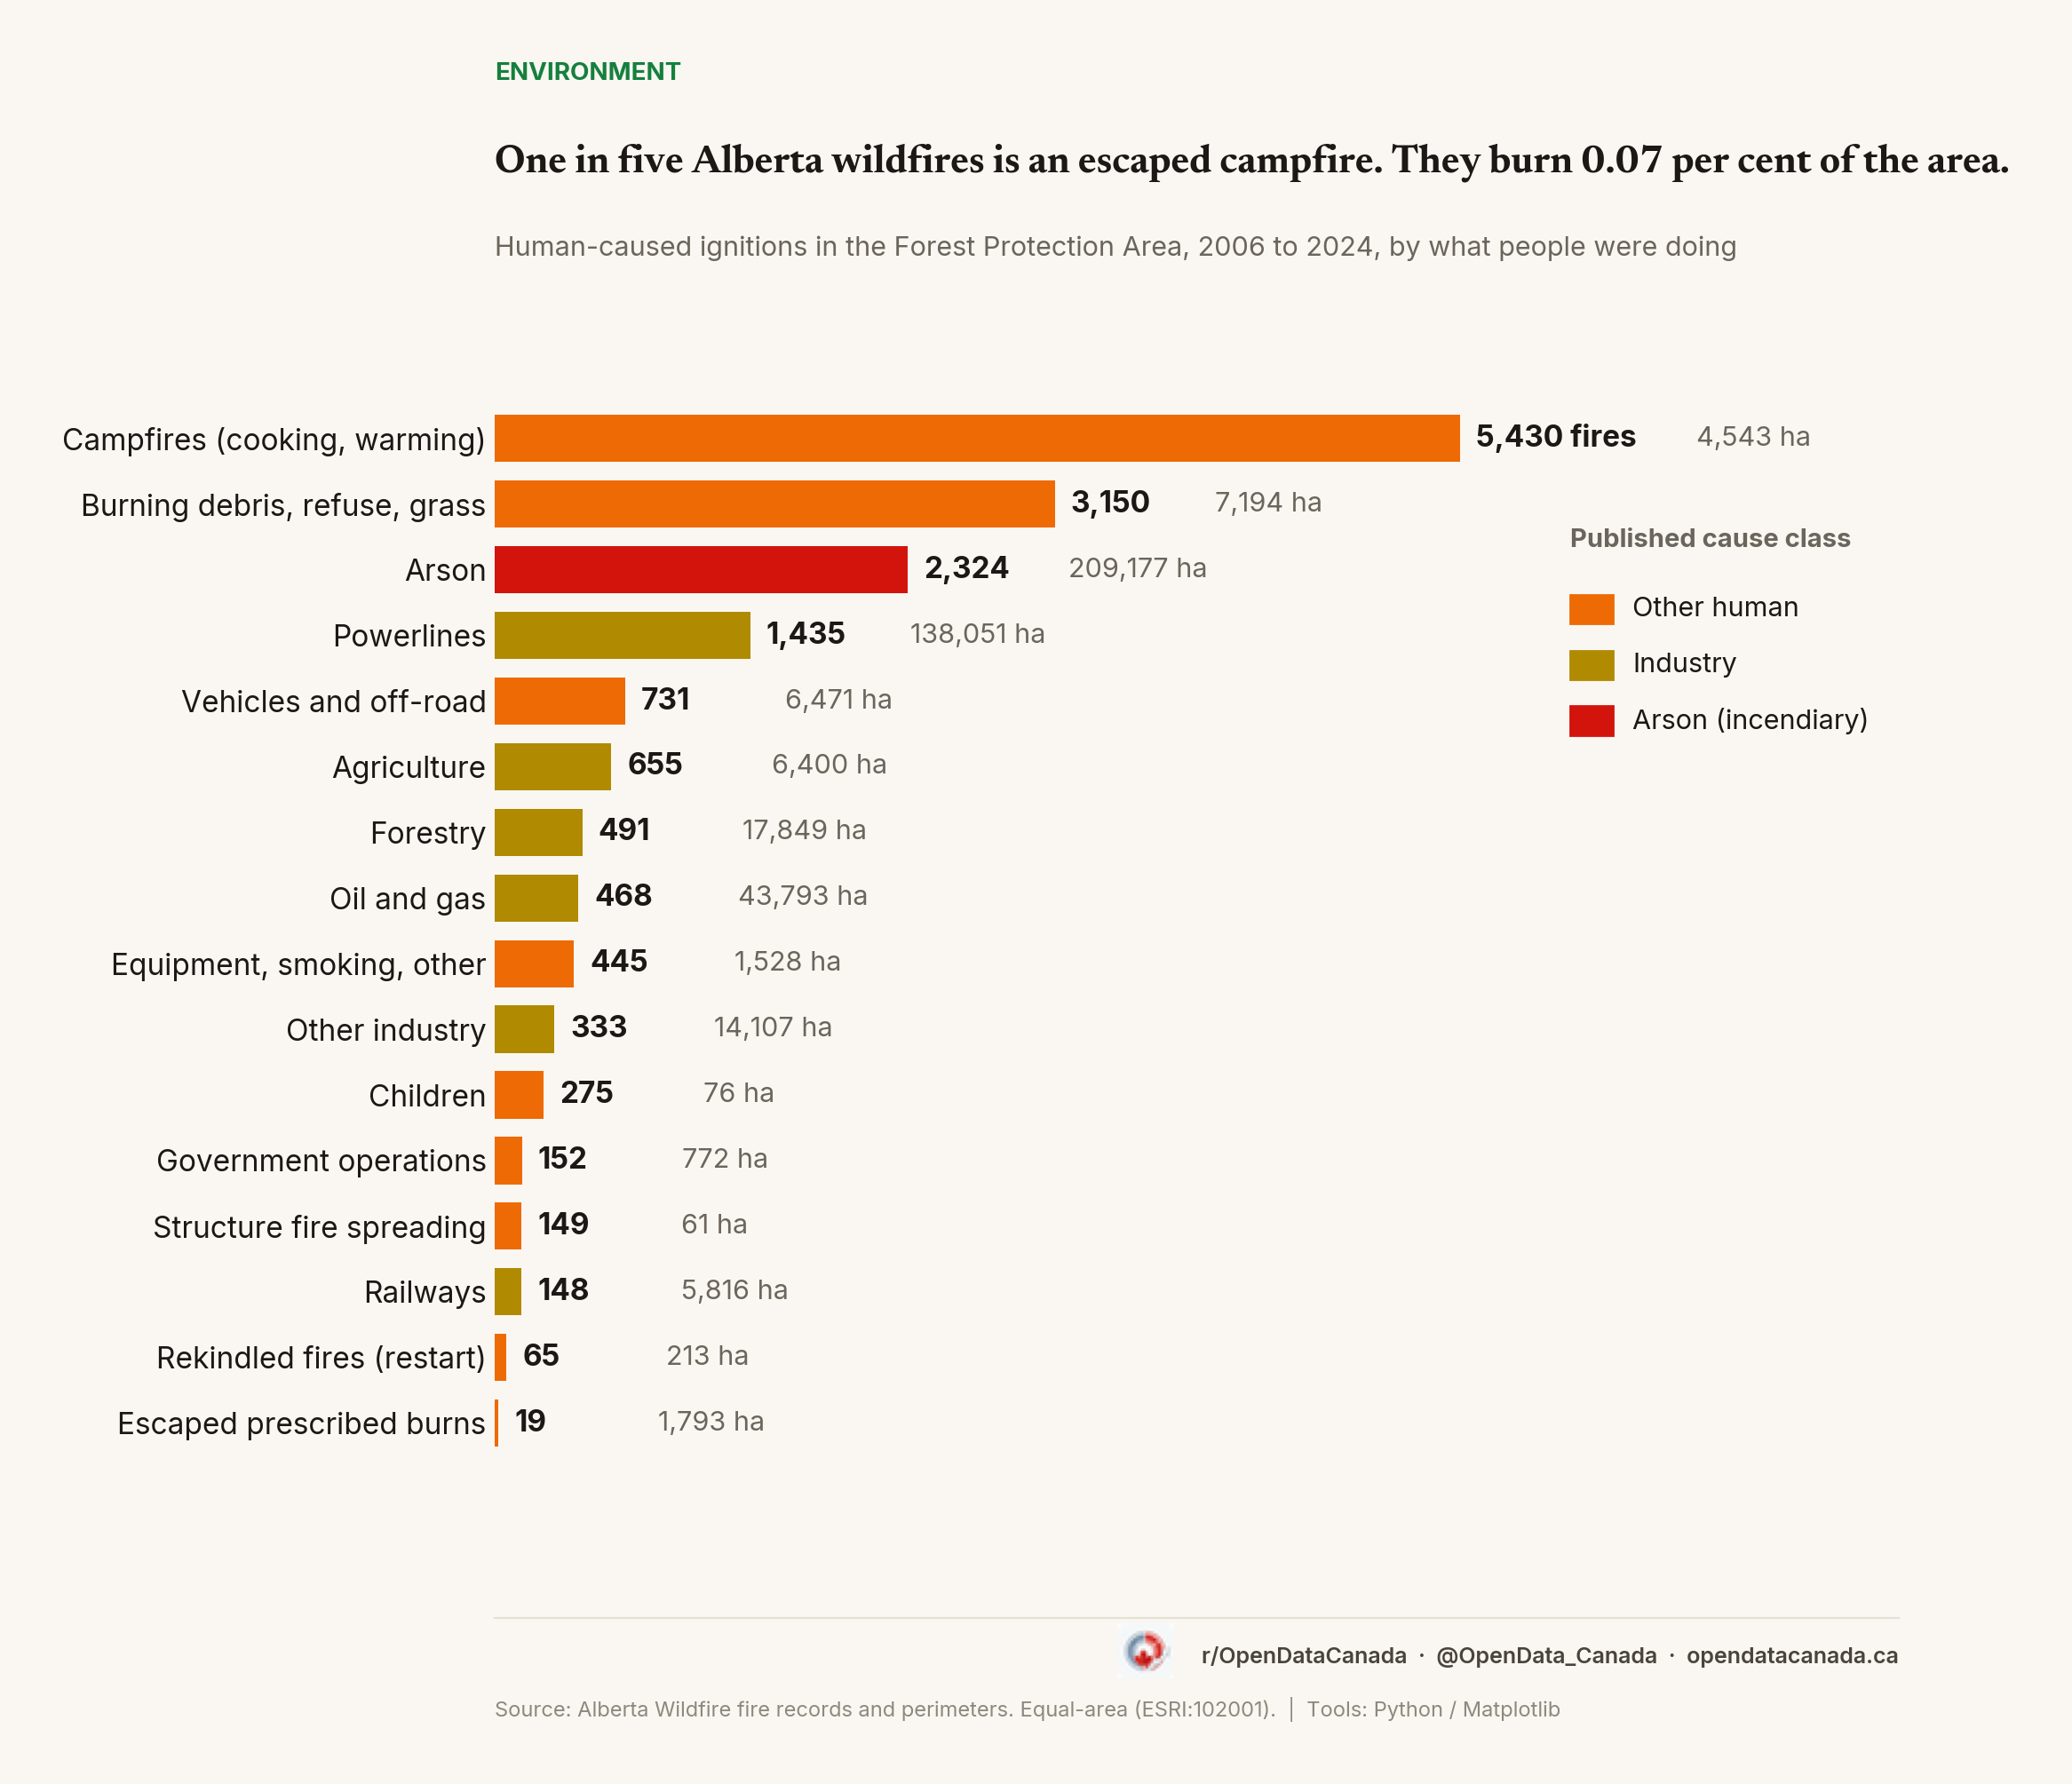
It is campfires. Cooking and warming fires account for 5,430 ignitions, one in five of every wildfire Alberta recorded in nineteen years, and more than arson, powerlines, forestry, oil and gas and agriculture put together. Alberta's own field for how they got away reads unsafe, abandoned or unattended for 99 per cent of them.
They burn 4,543 hectares. That is 0.07 per cent of the area inside that zone, and Alberta's own size field puts the average escaped campfire at just over a hectare before somebody catches it. Add the next category down — burning debris, refuse and grass, another 3,150 fires — and a third of every wildfire Alberta recorded comes to under two tenths of one per cent of the burned area.
The ranking inverts when you weigh it. Powerlines are fourth among the human sources, at 1,435 fires, and burn 138,051 hectares: thirty times what every campfire in the record burned. This is the same arithmetic as the flip above, one level further down. The things people do most often are the things that get caught first.
A fifth has no cause on Alberta's file
Alberta's detail comes with a hole. Of the eight million hectares it maps, 1,568,097 have no cause record in the province's file at all, and another 1,339,487 were investigated without a conclusion. Alberta cannot name a cause for 36 per cent of the area on its own map.
Most of that first number, it turns out, is not missing. It is filed somewhere else.
Alberta's cause database covers only the Forest Protection Area, so the 1,003 perimeters outside it have nothing to join to. We tested every one of them against three other records: the federal National Fire Database, British Columbia's fire polygons for the perimeters that cross the line, and the National Burned Area Composite, the satellite-derived national layer Natural Resources Canada assembles from what each agency reports. Between them they name an ignition source for 1,499,525 hectares — 96 per cent of the gap.
The national parks are most of it, and the assumption we published holds: of the 950,211 hectares of park perimeter, 949,911 have a federal cause on file. Outside the parks, where the federal points alone had reached 71,132 hectares, another 478,482 turn out to be recorded — 303,016 of them in the national composite, 175,466 in British Columbia's own file.
The composite is the uncomfortable part. Its cause field is not Ottawa's finding. NRCan's documentation states that it "describes the ignition source of the fire recorded by the agency", and for 89 per cent of the hectares it recovers here, that agency is Alberta. The province reported these causes to the national system. It does not publish them in the file it releases.
None of this can move the arson number. No record outside Alberta separates a deliberately set fire from any other human one: the federal database codes human, natural or undetermined, British Columbia codes lightning, person or unknown, and the composite codes human, natural or undetermined. Every hectare recovered here is natural or human and never more specific than that. The 209,177-hectare arson total is exactly what it was, and nothing in this exercise could have raised or lowered it.
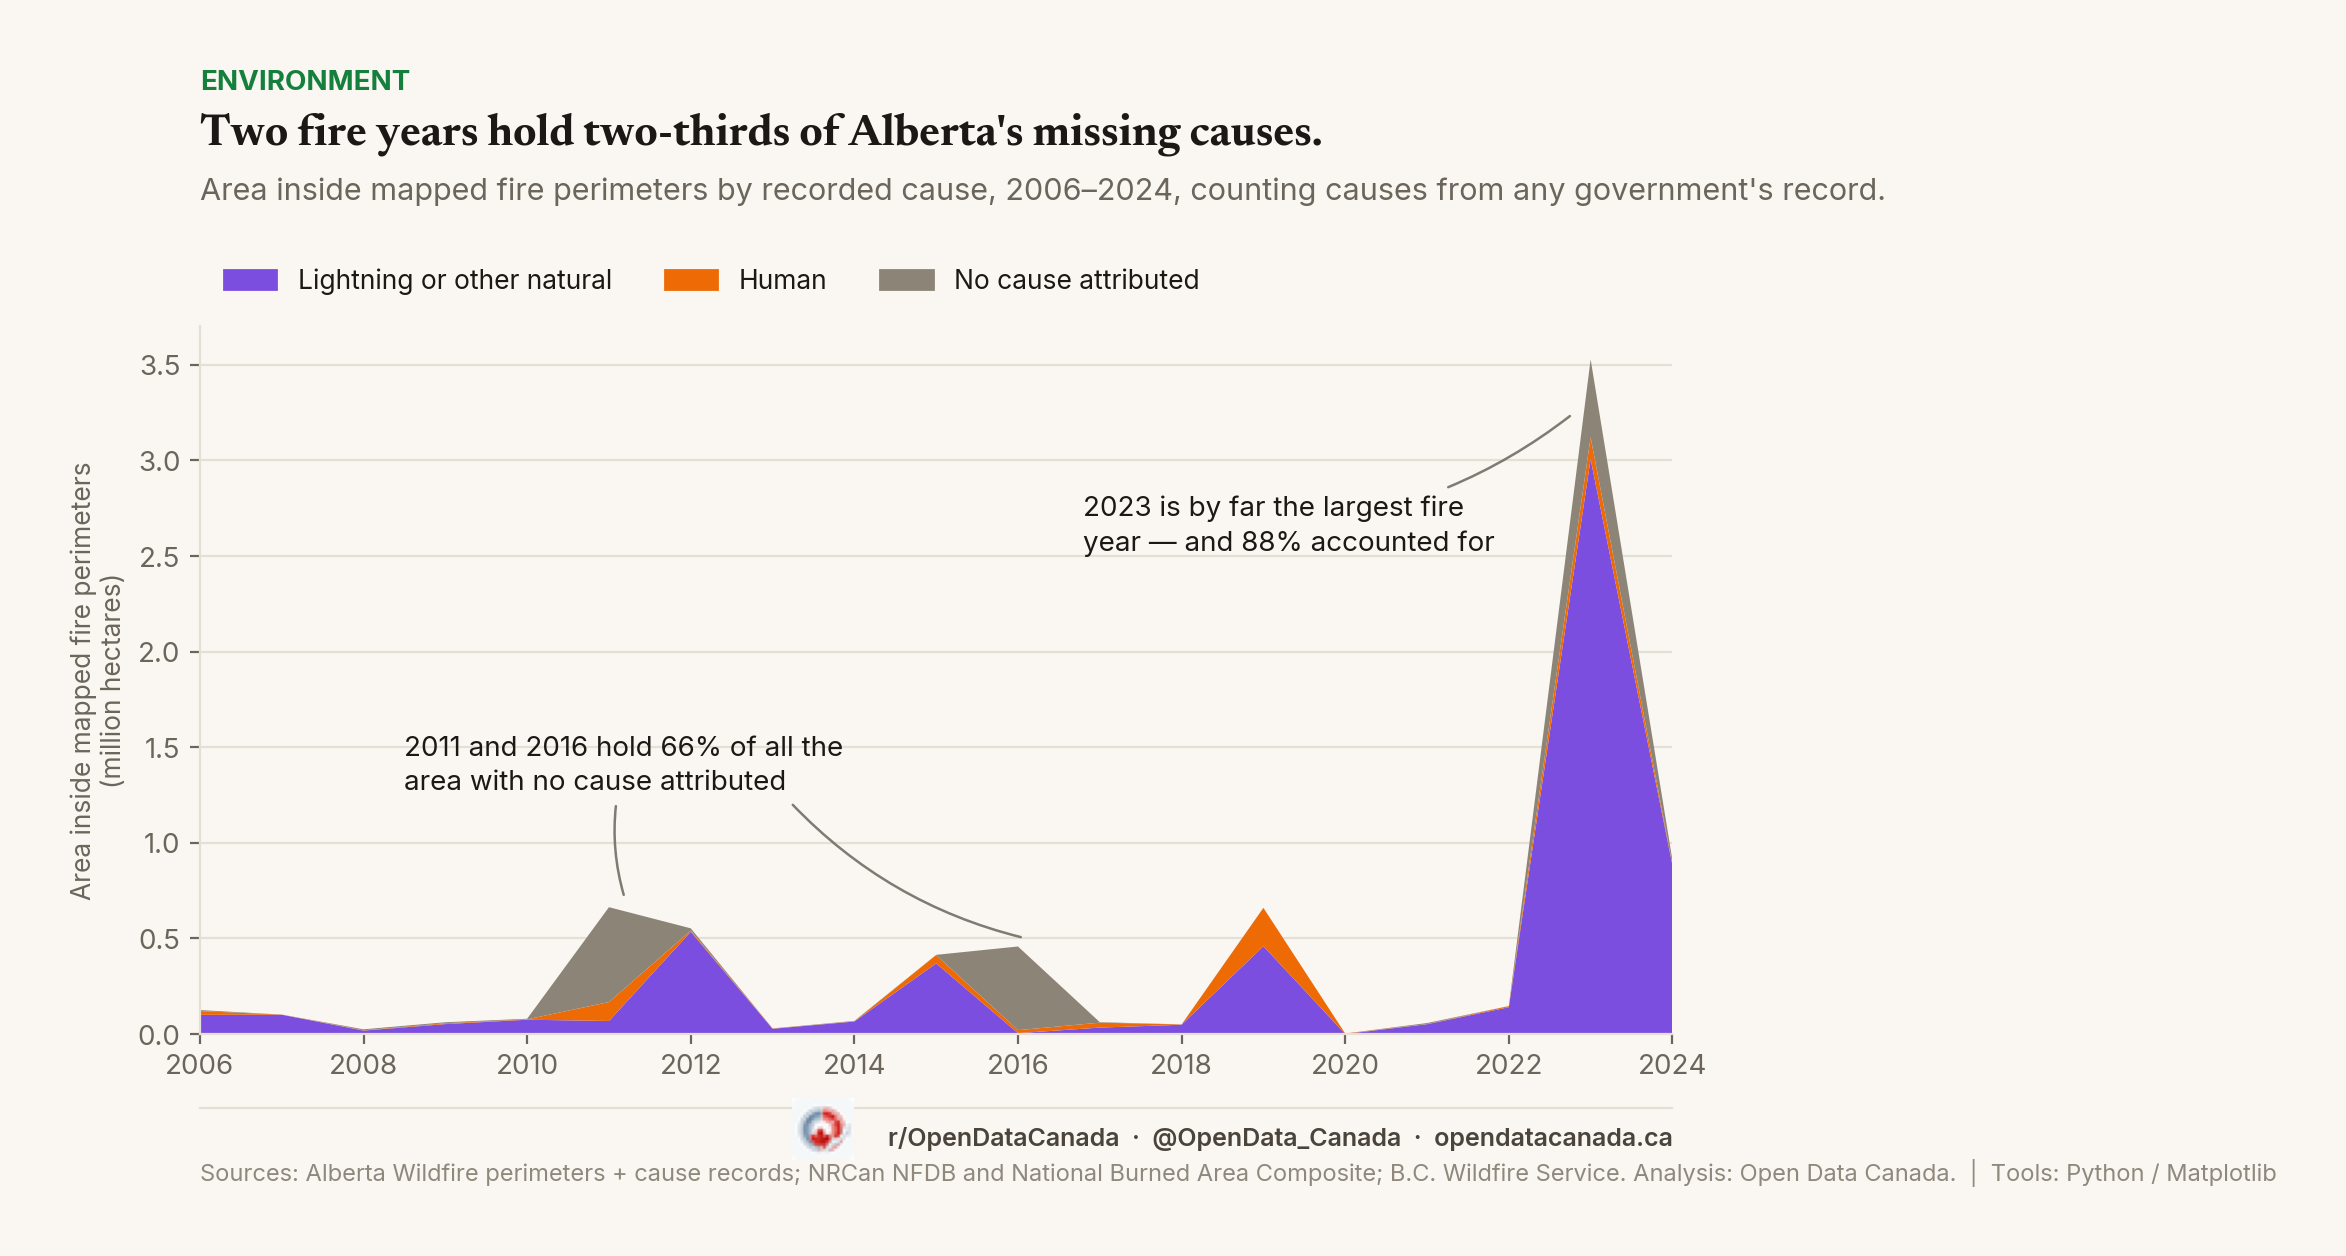
The gap lands in the years that matter. The 2016 Fort McMurray fire, which pushed almost 88,000 people out of their homes, is still officially uncaused; investigators got as far as "probably human" and stopped. Ninety-six per cent of Alberta's 2016 burned area sits under investigation, and 2011 is not much better at 75 per cent. Between them those two years hold 66 per cent of all the area no government can explain. The record-setting 2023 season is not one of them: with every government's records counted, 88 per cent of it is accounted for. Nothing in what is left supports a bigger arson number, and nothing rules one out.
British Columbia has the opposite problem. It names a cause for 99.5 per cent of what burns and the record is still nearly useless, because lightning, person and unknown is the whole vocabulary.
What would fix it
This one is cheap, because the work is already done. Alberta reports these causes to the national composite, and it already flags which fires burned on park land. The fix is not an investigation, it is a publication: carry the causes the province files nationally, and the federal ones for the parks, into the file it releases. BC could publish what its investigators find and never release.
Until then, anyone putting a number on how much of Canada burned because someone lit it is filling a hole in the record with something they brought with them. Lightning burns most of this country. People start most of the fires and burn very little of it. Set aside the one fire carrying Alberta's arson total and powerlines burned thirteen times what arsonists did. And for a fifth of what Alberta maps, the province's own file says nothing — even though, for almost all of it, somebody wrote it down somewhere else.