Energy · 4 min read
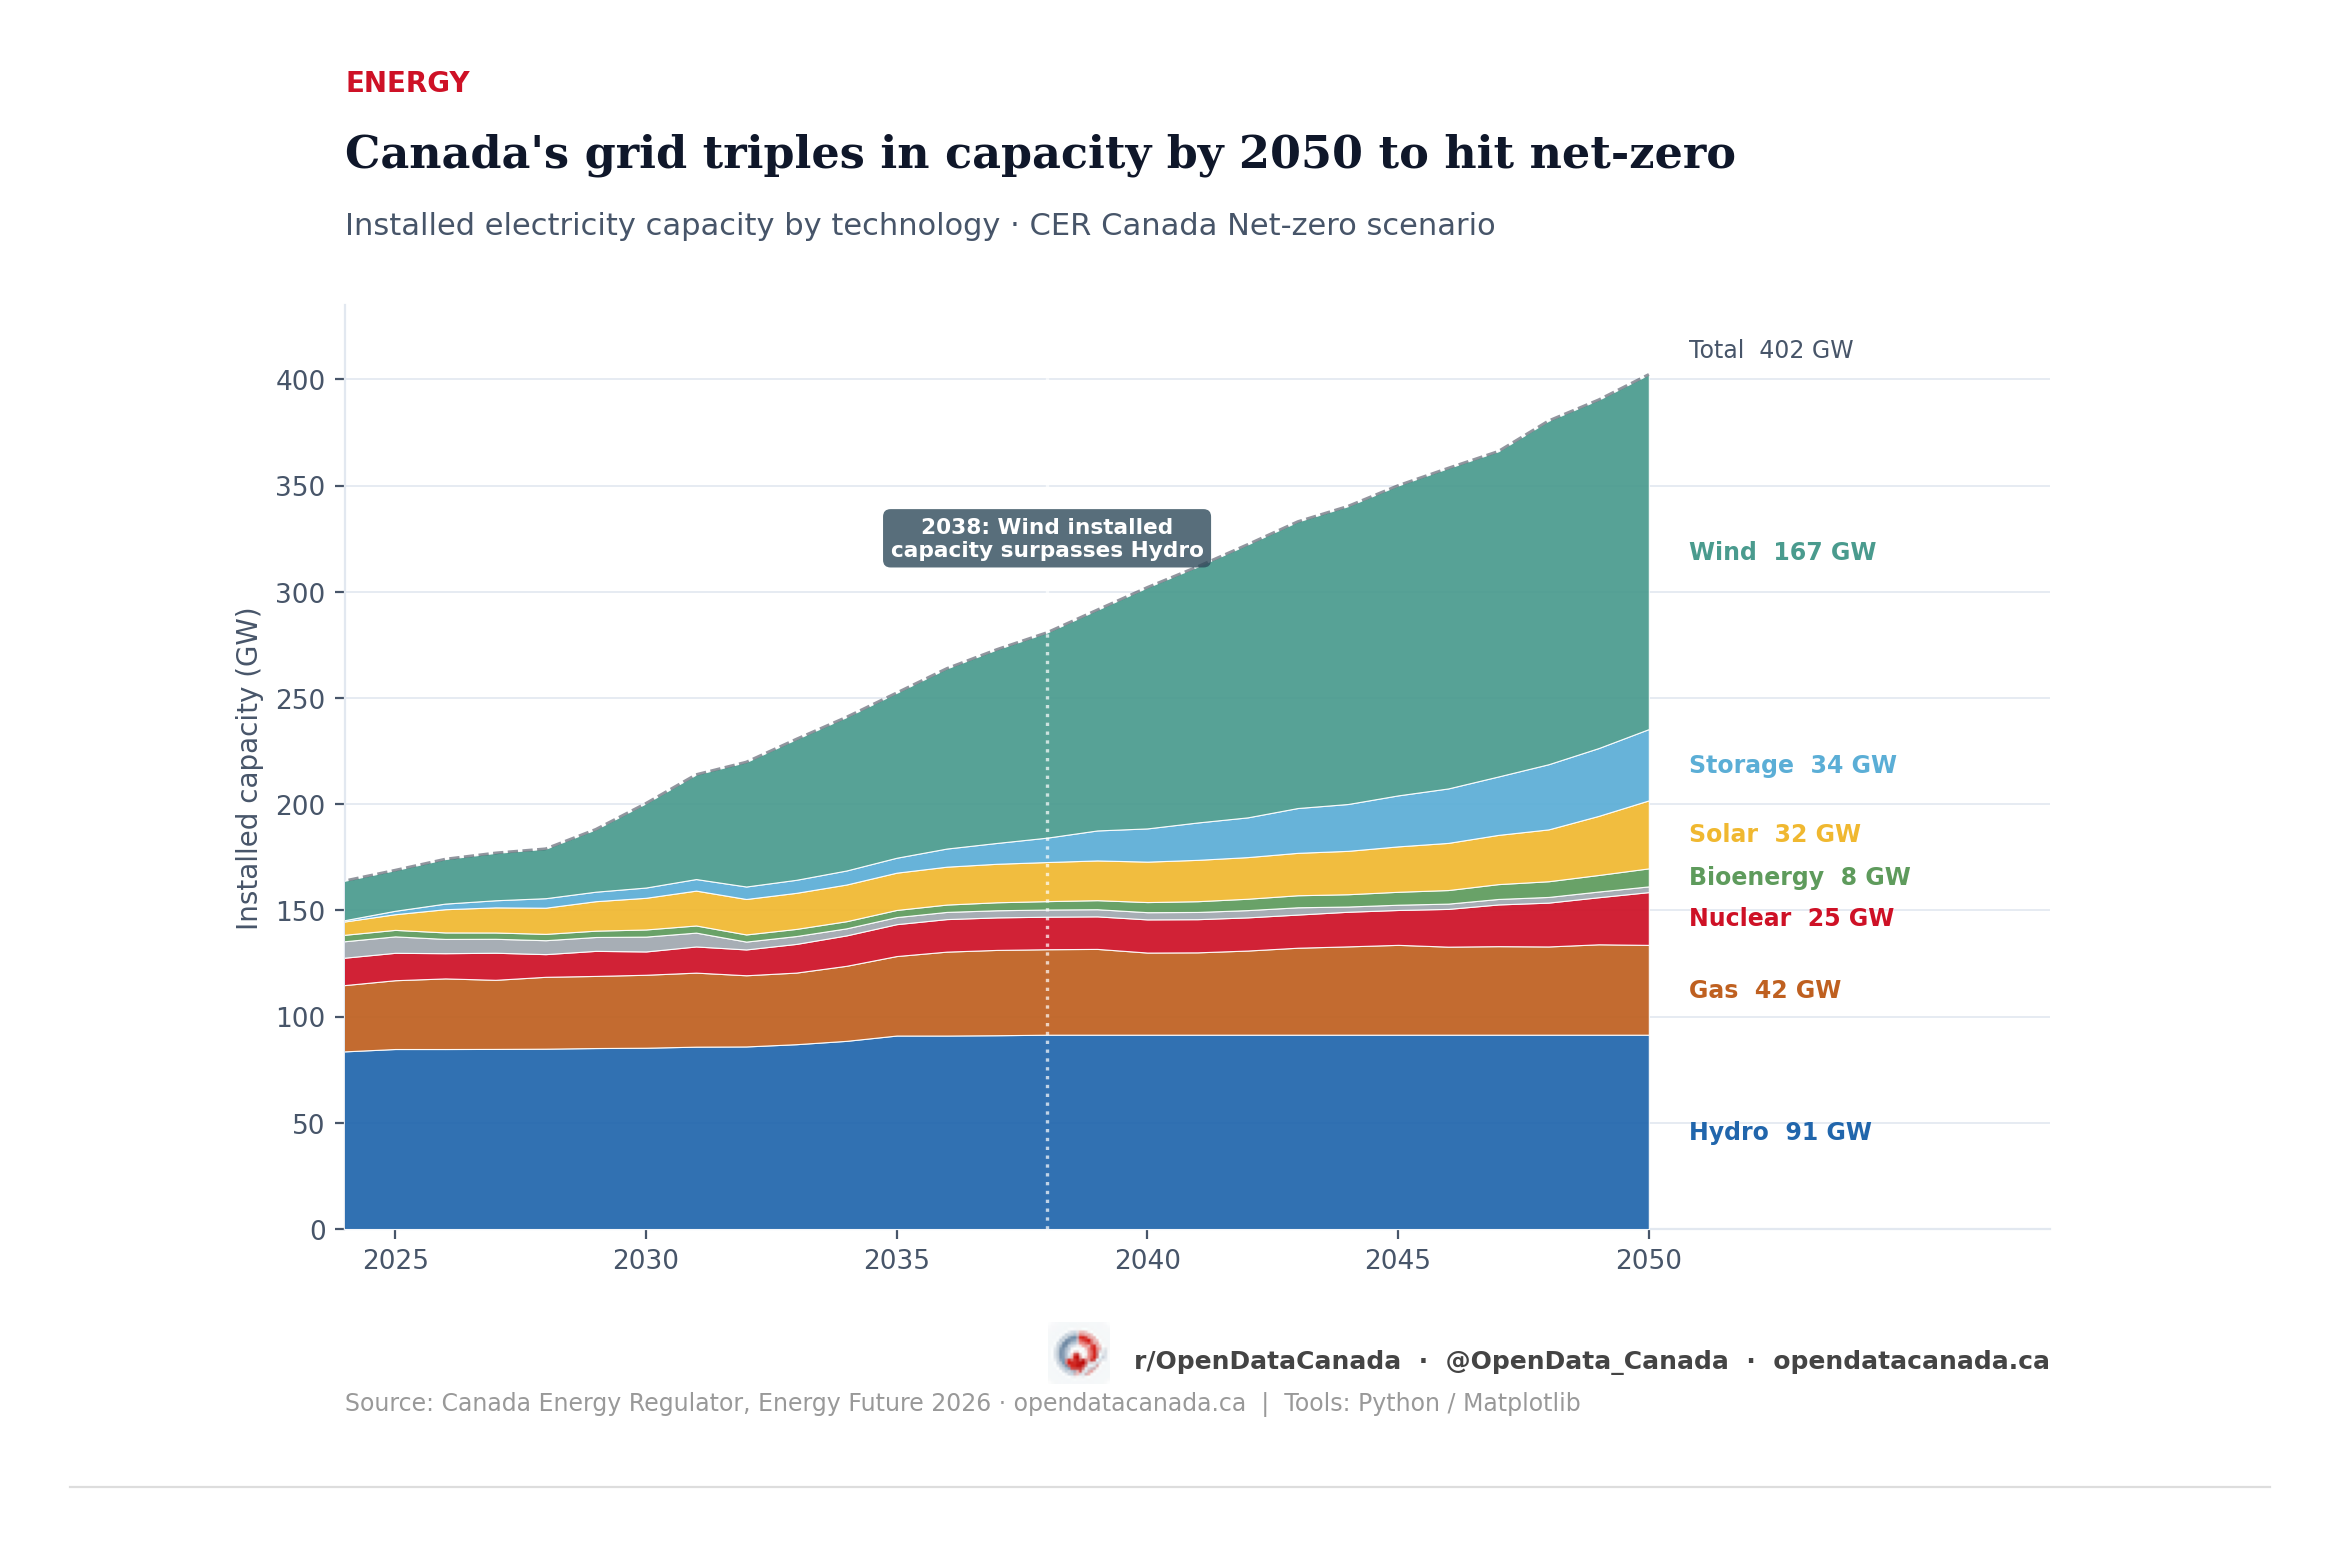
To hit net-zero, Canada's grid has to grow to about two and a half times its current size, from 164 GW today to 402 GW by 2050.
The Canada Energy Regulator's net-zero scenario maps every technology from 2024 to 2050. Wind grows ninefold to become the biggest source of capacity, about 40% of the 2050 grid, though it generates a smaller share of the actual electricity. Hydro stays roughly flat, gas keeps a smaller but real role, and nuclear stays modest. It is the regulator's modelling of one pathway to net-zero, not a forecast.
Canada's electricity grid today runs mostly on water. Hydro accounts for roughly half of all installed capacity, 84 GW out of 164 GW, built up over a century of dam construction in Quebec, British Columbia, Manitoba, and Ontario.
The Canada Energy Regulator's net-zero scenario, published in April 2026, models what happens to that grid between now and 2050 if Canada follows a pathway consistent with its legal 2050 net-zero commitment. The CER's answer, in one chart:
Which scenario is this? The CER published four scenarios for Canada's grid in 2050: Lower (270 GW, slow growth and weak policy), Current Measures (308 GW, only existing policies), Higher (360 GW, faster growth), and Canada Net-zero (402 GW, full climate commitment). This article uses the Net-zero scenario — the only pathway the CER models as consistent with Canada's 2050 legal target. Current Measures is the more realistic "where we are headed" baseline; the gap between the two is 94 GW, roughly the size of Canada's entire current non-hydro grid. All of it is model output, not a prediction of what will happen.
Capacity share is not generation share. A gigawatt of wind and a gigawatt of nuclear do not produce the same amount of electricity, because they run at very different capacity factors — the share of the time a technology actually generates at full output. For the three technologies where we have sourced capacity factors, the 2050 picture looks different once you convert capacity to estimated generation:
| Technology | 2050 capacity | Share of these 3, by capacity | Share of these 3, by estimated generation |
|---|---|---|---|
| Wind | 167 GW | 59% | ~43% |
| Hydro | 91 GW | 32% | ~39% |
| Nuclear | 25 GW | 9% | ~19% |
Nuclear's slice roughly doubles once you weight for its 85–90 percent capacity factor. Wind's slice shrinks, even though it has by far the most installed capacity. This comparison is illustrative, not a full generation mix — it covers only wind, hydro, and nuclear, the three technologies whose capacity factors are sourced in the methodology; gas, solar, and storage aren't included because their capacity factors aren't sourced here.
Five things the chart shows
1. Wind grows ninefold, overtaking hydro in 2038.
Wind expands from 18 GW today to 167 GW by 2050, becoming Canada's largest single source of installed capacity. In 2038, wind's installed capacity surpasses hydro's for the first time in Canadian history. That crossover does not mean wind generates more electricity than hydro — wind runs at roughly 30 percent capacity factor against hydro's 45–55 percent — but it marks the end of a century in which water defined the Canadian grid.
2. Hydro stays; it just stops growing.
Hydro capacity rises modestly from 84 GW to 91 GW, mostly existing facilities with small additions in Quebec and BC. As a share of the grid it falls from 51 percent to 23 percent, not because dams are retired but because everything else grows faster around them. Canada's hydro base remains the backbone of firm, dispatchable power.
3. Gas grows in absolute terms, never fully leaves.
Natural gas capacity increases from 31 GW to 42 GW by 2050 under the net-zero scenario. The growth comes through plants equipped with carbon capture, utilization and storage (CCUS), which the CER models as compatible with net-zero. Gas's share of the grid falls from 19 percent to 10 percent as the total grows, but in absolute gigawatts it expands. In this model, gas does not go away.
4. Nuclear stays modest.
Nuclear capacity (existing CANDU fleet plus new large reactors and small modular reactors, or SMRs) grows from 13 GW to 25 GW. As a share of the grid it falls from 8 percent to 6 percent. Nuclear's value is in generation, not capacity: it runs at 85–90 percent capacity factor year-round, contributing about 13 percent of Canada's electricity today from 8 percent of installed capacity. The CER model keeps that role, but does not expand it dramatically.
5. Storage and solar emerge from near zero.
Battery storage and hydrogen storage grow from essentially nothing in 2024 to 34 GW by 2050. Utility and distributed solar reaches 32 GW. Both are largely absent from Canada's current grid and require the fastest proportional build of any technology in the scenario.
What this model is, and is not
The CER net-zero scenario is the regulator's analytical modelling of one pathway consistent with Canada's legally binding 2050 net-zero target under the Canadian Net-Zero Emissions Accountability Act (2021). It is a scenario, not a government construction plan; treat every number past 2026 as model output.
The more conservative Current Measures scenario, which models only policies already enacted, reaches 308 GW by 2050. The gap between that and the 402 GW net-zero pathway is 94 GW, roughly the size of Canada's entire current non-hydro grid.
The net-zero pathway means adding about 238 GW of capacity between now and 2050, roughly 9 GW every year for a quarter-century. Wind alone accounts for nearly 150 GW of that, close to 6 GW a year, or about a third of today's entire wind fleet built new each year.
Closing that gap depends on the nuclear strategy, the clean electricity regulations, and interprovincial transmission expansion all advancing at a pace and scale Canada has not demonstrated since the 1970s.
Read more
For a deeper look at where nuclear fits, and the gap between Ontario's plans and what the IESO says it needs, see: Canada's nuclear strategy is built on a number the regulator's own model doesn't deliver →